はじめに
ちょっと前 (1年前) にラズパイで温度湿度可視化してみたときのメモ.
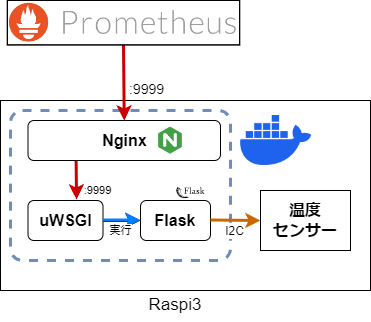
最終的にPrometheus・Grafanaで可視化できることを目指します.
環境
使用するラズパイの環境は以下.
- raspi: 3B
- OS: ubuntu 20.04
温度湿度センサー (AM2320)
温度センサーには,AM230を使用します.

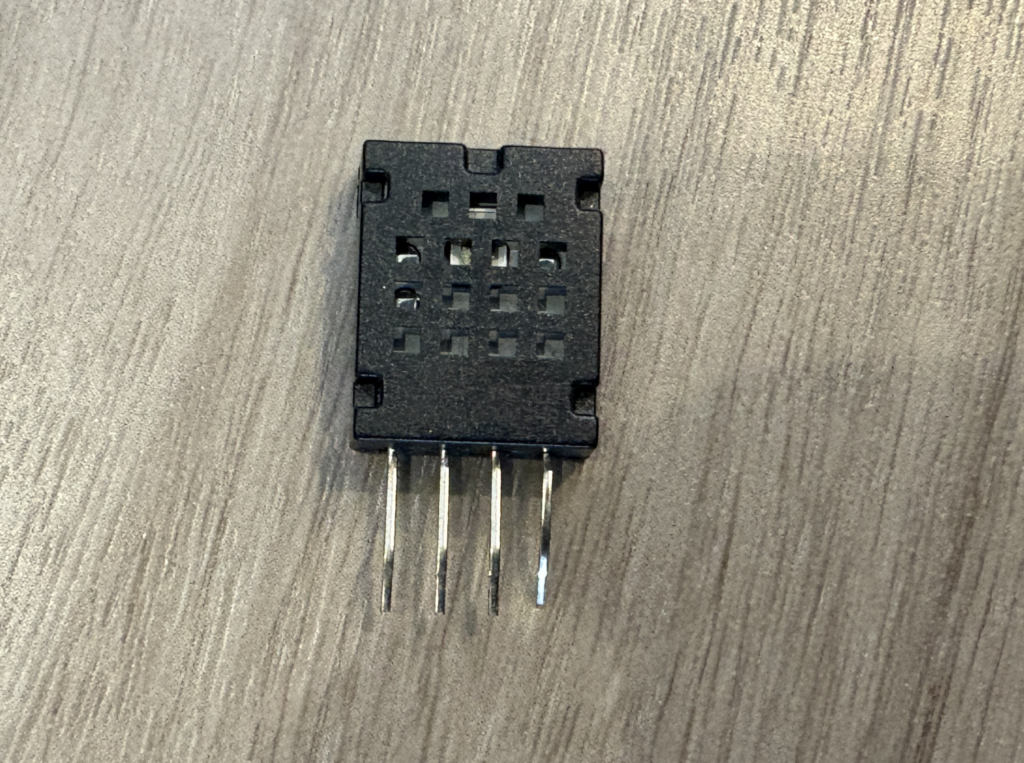
また,ラズパイと接続するためのジャンパーワイヤーとブレッドボードも必要になります.

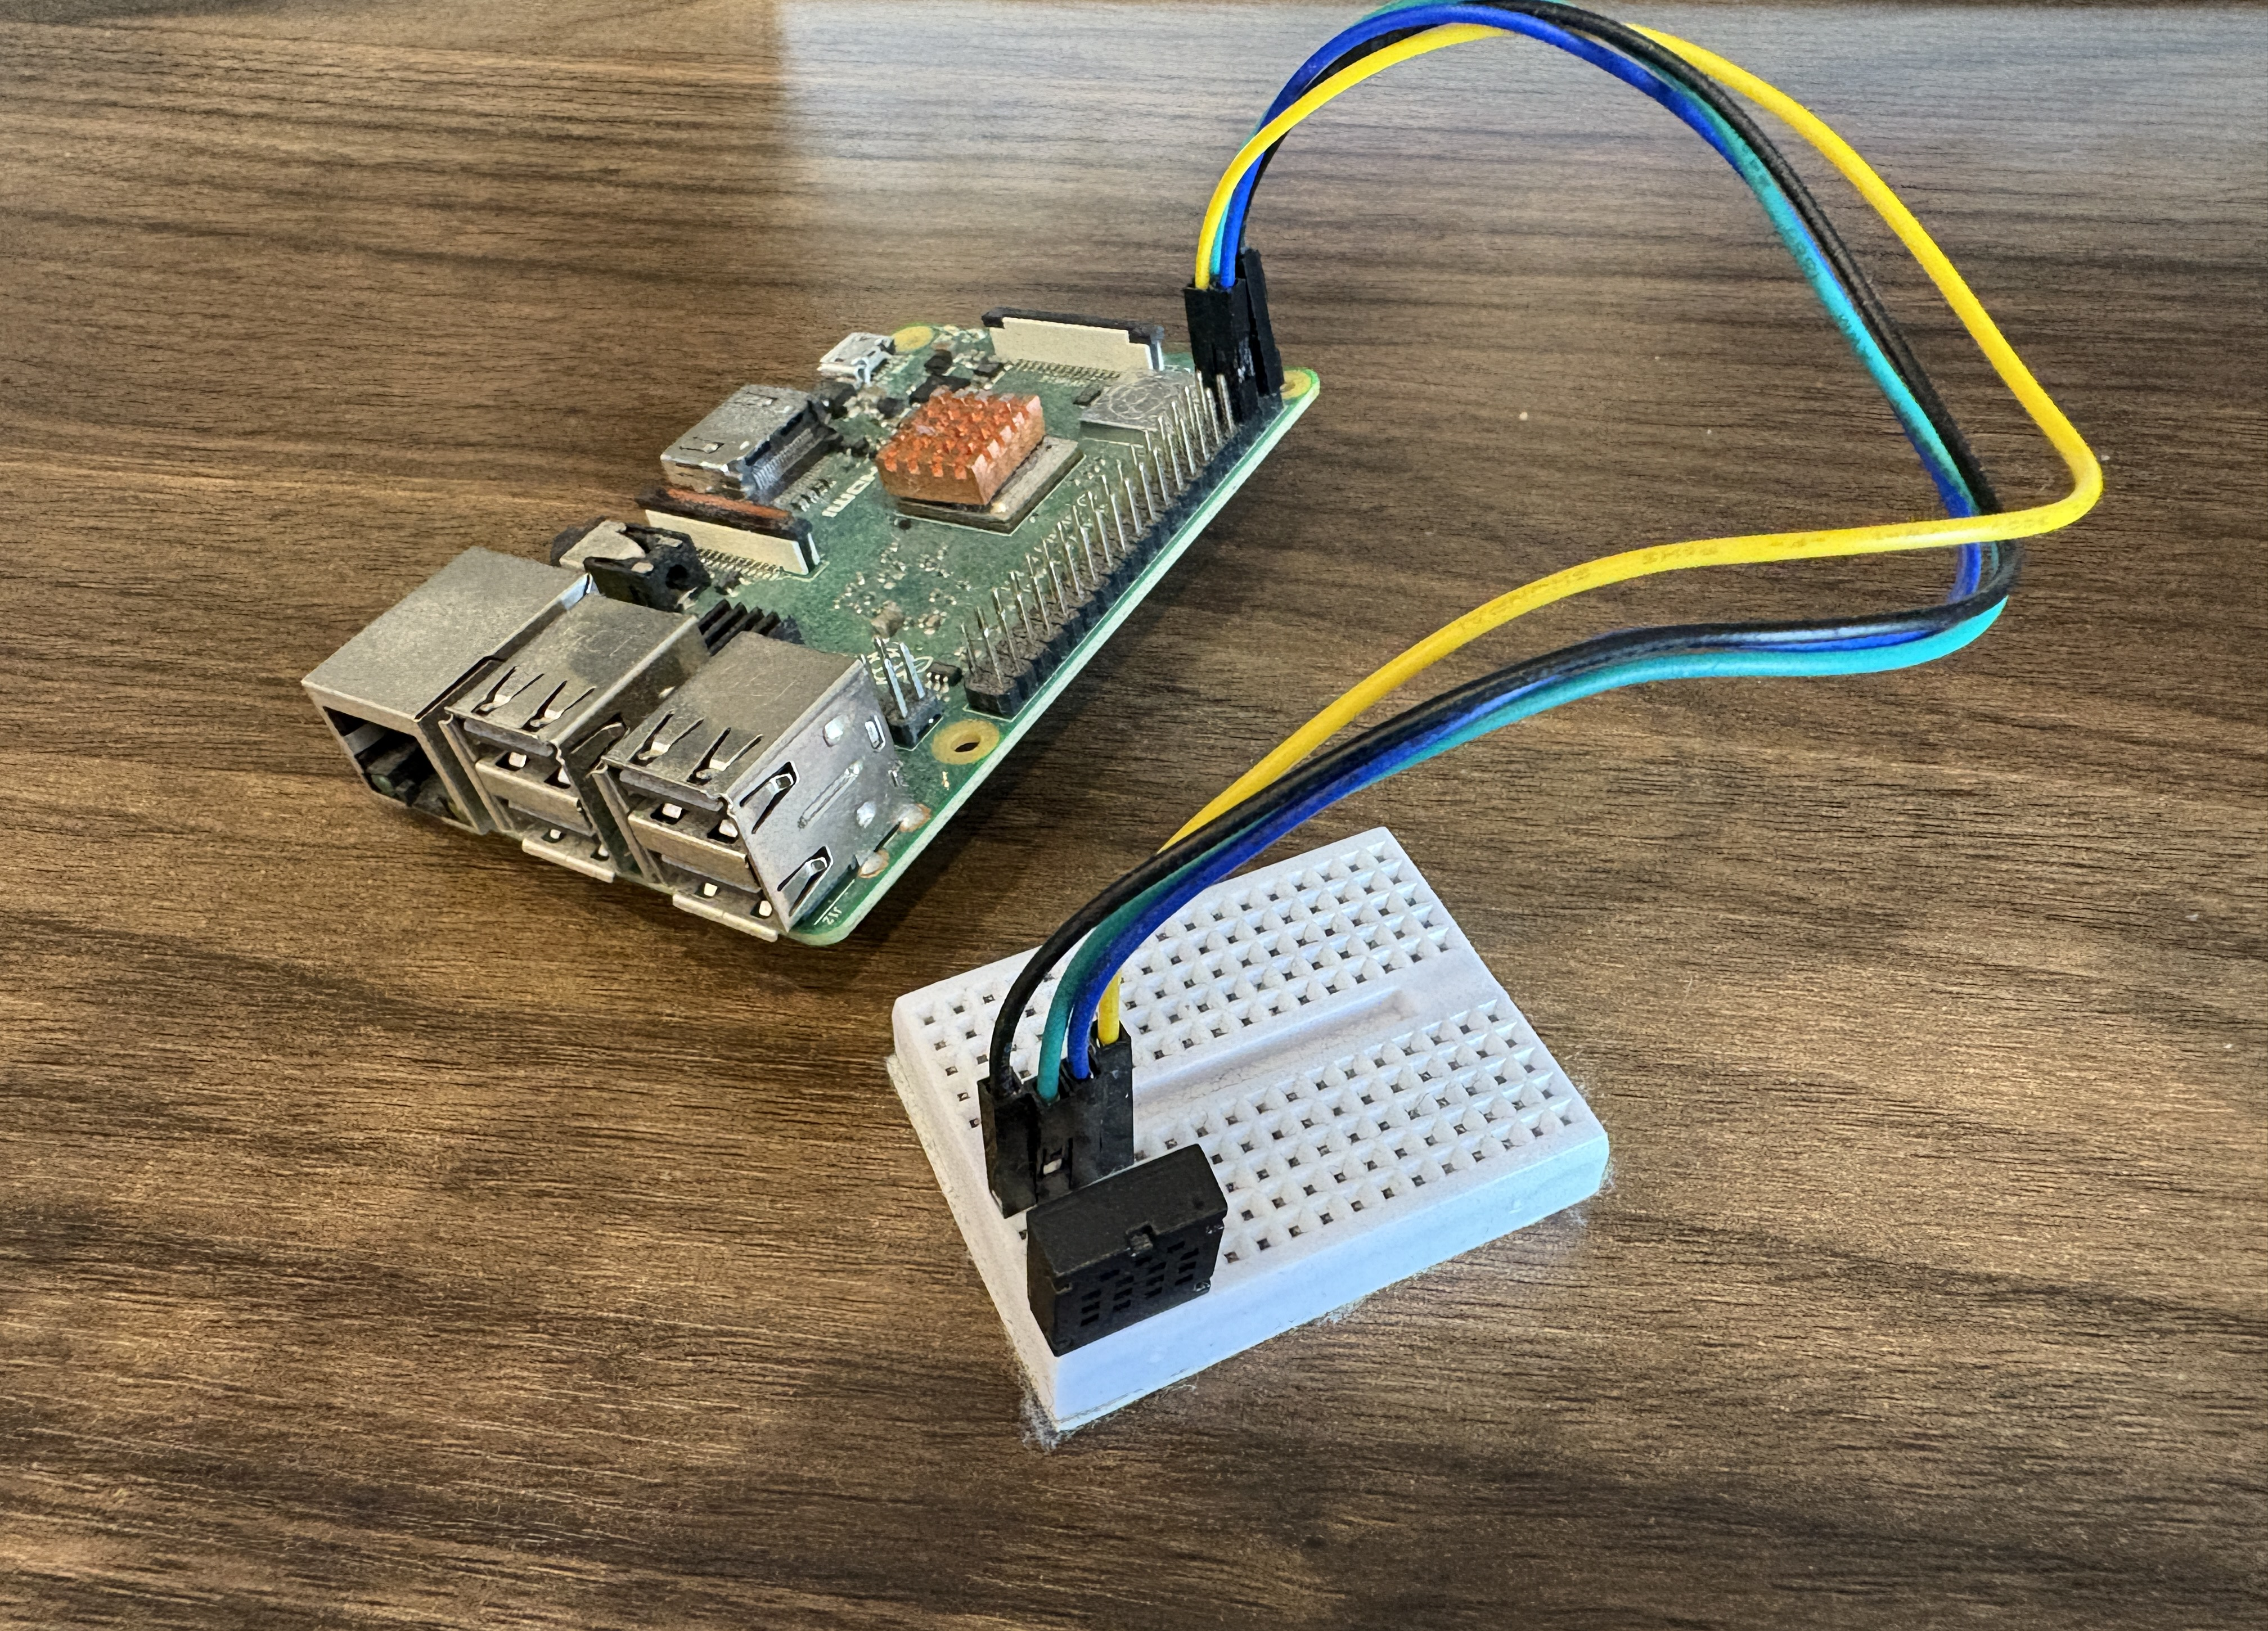
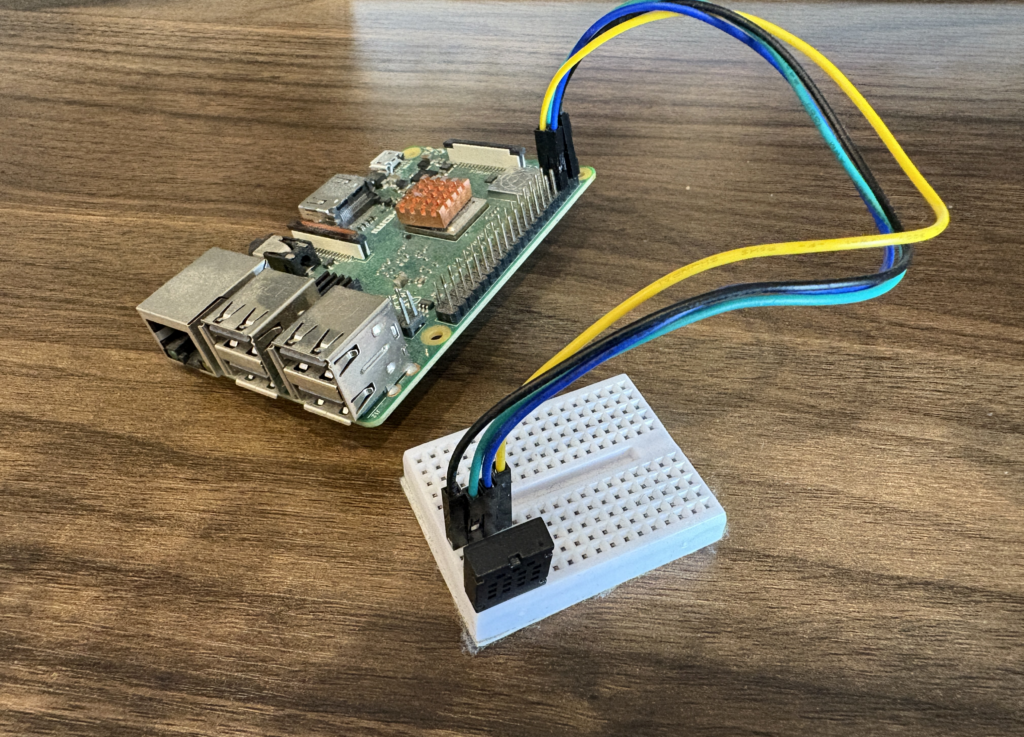
ラズパイとセンサーの接続
ラズパイとセンサーを接続していきます.
I2C
ラズパイとセンサーはI2C(Inter-Integrated Circuit)で通信します.I2Cは低速な周辺機器を接続するシリアル通信の規格です.
I2Cでは,マスタスレーブの方式で通信します.マスタは複数のスレーブに呈して,データの読み取り等が可能です.
情報通信では以下2つのバスラインを使用します.
- SDA (Serial Data line): データ通信
- SCL (Serial Clock line): クロック供給
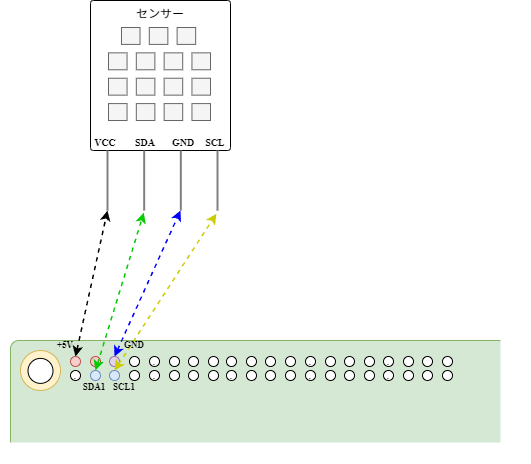
ラズパイとの接続
ラズパイと温度センサーの接続は,SDA/SCLの接続と,電源・GNDの接続が必要です.
今回は以下の様に接続します.
センサーの値の読み取り
接続後,I2C Toolsのi2cdetectコマンドで接続できていることを確かめます.また,センサーがどのアドレスであるのかもメモしておきます.
shu1r0@raspi3node1:~/workspace$ i2cdetect -l
i2c-1   i2c             bcm2835 (i2c@7e804000)                  I2C adapter
shu1r0@raspi3node1:~/workspace$ sudo i2cdetect -y 1
     0  1  2  3  4  5  6  7  8  9  a  b  c  d  e  f
00:                         -- -- -- -- -- -- -- --
10: -- -- -- -- -- -- -- -- -- -- -- -- -- -- -- --
20: -- -- -- -- -- -- -- -- -- -- -- -- -- -- -- --
30: -- -- -- -- -- -- -- -- -- -- -- -- -- -- -- --
40: -- -- -- -- -- -- -- -- -- -- -- -- -- -- -- --
50: -- -- -- -- -- -- -- -- -- -- -- -- 5c -- -- --
60: -- -- -- -- -- -- -- -- -- -- -- -- -- -- -- --
70: -- -- -- -- -- -- -- --
センサーを読み取るコードは以下となります.ファイル名はcapture_exporter.pyです.
import sys
import time
import smbus


SLAVE_ADDR = 0x5c  # i2cdetectで確認したアドレス

FUNCTION_READ = 0x03


def get_trh(i2c):
    read_register = 0x00  # 読み取るレジスタアドレス
    data_num = 0x04  # データ数
    # スリープの解除
    try:
        i2c.write_i2c_block_data(SLAVE_ADDR, 0x00, [])
    except:
        pass

    # 読み取り命令 (800μsec以上,3msec以下で要求を送信)
    time.sleep(0.002)
    i2c.write_i2c_block_data(SLAVE_ADDR, FUNCTION_READ, [read_register, data_num])

    # データ取得
    time.sleep(0.015)
    block = i2c.read_i2c_block_data(SLAVE_ADDR, read_register, data_num+4)
    humidity = float(block[2] << 8 | block[3])/10
    temperature = float(block[4] << 8 | block[5])/10

    return temperature, humidity


def main ():
    i2c = smbus.SMBus(1)
    try:
        while True:
            temperature, humidity = get_trh(i2c)
            print('温度={}℃  湿度={}%'.format(temperature, humidity))
            time.sleep(1)

    except KeyboardInterrupt:
            sys.exit(0)


if __name__ == '__main__':
    main()
読み取り部分では,Read命令である0x03で値を読み取ってます.このFunctionCodeは,データシートに記載されているものです.
    # 読み取り命令 (800μsec以上,3msec以下で要求を送信)
    time.sleep(0.002)
    i2c.write_i2c_block_data(SLAVE_ADDR, FUNCTION_READ, [read_register, data_num])

    # データ取得
    time.sleep(0.015)
    block = i2c.read_i2c_block_data(SLAVE_ADDR, read_register, data_num+4)
    humidity = float(block[2] << 8 | block[3])/10
    temperature = float(block[4] << 8 | block[5])/10
実行
センサー部分だけをローカルでの実行していきます.
pip3 install smbus
python3 capture_exporter.py &
ここで正しくセンサーの値を読み取れているのであれば,温度と湿度がプリントされていくはずです.
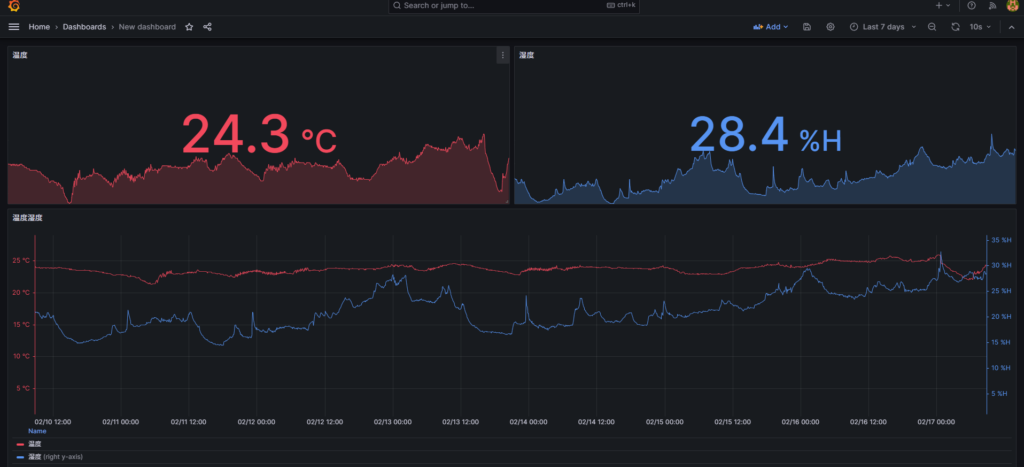
Grafanaでの可視化
Exporter側は作成しますが,Prometheus ServerとGrafanaの環境はすでにあることを前提にしてます.
Exporterの作成
読み取った値をGrafanaで可視化するためにExporterを作成します.
最終的なファイル構成は以下となります.
$ tree --dirsfirst -L 3
.
├── flask
│   └── Dockerfile
├── nginx
│   └── nginx.conf
├── trh_exporter
│   ├── capture_exporter.py
│   ├── capture_trh.py
│   ├── __init__.py
│   └── __main__.py
├── docker-compose.yml
├── README.md
├── requirements.txt
└── uwsgi.ini
まずは,APIを定義するcapture_exporter.pyです.ExporterのAPI実現のためにFlaskも利用しています.メトリクスの定義として,温湿度はリアルタイムの数値なのでGaugeで定義します.また,Labelは好みですが,deviceでraspi3を指定しています.
import smbus
from flask import Flask, Response
from prometheus_client import Gauge, Counter, generate_latest

from .capture_trh import get_trh

app = Flask(__name__)

CONTENT_TYPE_LATEST = str("text/plain; version=0.0.4; charset=utf-8")

number_of_requests = Counter("number_of_requests", "The number of requests")
temperature = Gauge("current_temperature", "temperature", ["device"])
humidity = Gauge("current_humidity", "humidity", ["device"])


i2c = smbus.SMBus(1)


@app.route("/metrics", methods=["GET"])
def return_trh():
    number_of_requests.inc()
    try:
        t, h = get_trh(i2c)
        print("温度={}℃  湿度={}%".format(t, h))
        temperature.labels(device="raspi3").set(t)
        humidity.labels(device="raspi3").set(h)
    except Exception as e:
        print("ERROR: " + str(e))
    return Response(generate_latest(), mimetype=CONTENT_TYPE_LATEST)
app.runする部分は__main__.pyに定義します.
from .capture_exporter import app


if __name__ == "__main__":
    app.run(debug=True, host="0.0.0.0", port=9999)
Docker
次にExporterを実行するための環境を作ります.
docker-compose以下の構成になってます.
version: '3'

services:

  flask:
    container_name: flask
    build:
      context: .
      dockerfile: ./flask/Dockerfile
    restart: always
    privileged: true
    volumes:
    - ./:/usr/src/app/
    environment:
      TZ: Asia/Tokyo
    command: uwsgi --ini /usr/src/app/uwsgi.ini

  nginx:
    container_name: nginx
    image: nginx:latest
    restart: always
    volumes:
    - "./nginx/nginx.conf:/etc/nginx/nginx.conf"
    ports:
      - "9999:9999"
    environment:
      TZ: Asia/Tokyo
また必要なファイルを構成していきます.
Dockerfileは以下のように定義します.
FROM python:3.10

RUN apt-get update && apt install -y i2c-tools python3-smbus

COPY ../requirements.txt /usr/src/app/
RUN pip3 install --no-cache-dir -r /usr/src/app/requirements.txt

WORKDIR /usr/src/app/
requirements.txt
smbus
flask
prometheus_flask_exporter
prometheus_client
uwsgi
uwsgi.ini
[uwsgi]
module = trh_exporter.capture_exporter
callable = app
master = true
processes = 1

socket = :9999

# 実行するpythonファイル
chdir = /usr/src/app/
wsgi-file = /usr/src/app/trh_exporter/capture_exporter.py

logto = /usr/src/app/capture_exporter.log
また,nginx.confは以下のように記述します.
# 実行ユーザー
user nginx;
# 使用可能process数
worker_processes 1;
# プロセスID
pid /var/run/nginx.pid;

# イベント処理モジュール
events {
  worker_connections  1024;
}

# http関連のモジュール
http {
  upstream uwsgi {
    server flask:9999;
  }

  server {
    listen 9999;
    charset utf-8;

    location / {
      include uwsgi_params;
      uwsgi_pass uwsgi;
    }
  }
}
あとは実行するだけです.
docker compoose up -dGrafanaでの可視化
Prometheus ServerとGrafanaの環境は構築済みです.
まず,Prometheusにデータを食わせるためにprometheus.ymlに以下を追記します.
  - job_name: Get Temperature and Humidity
    static_configs:
      - targets: ['raspi3node1.shu1r0.net:9999']
あとはGrafanaで可視化するだけ!! おわり!

コメント